 .
.This brief tutorial is about defining and graphing points and vectors in Graphing Calculator. Please refer to GC's Help feature for information about this and other features of Graphing Calculator.
To define the point (3,4) in GC:
Type "A = <ctrl/cmd 2> 3 <tab> 4", as in .
You can put several point defintions on one line by separating them with a comma.
To graph a point in GC:
Enter the point's label on a single line
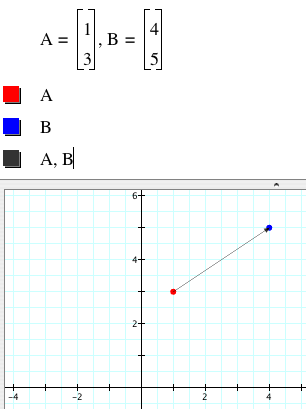
To graph a vector defined by two points:
Enter the two points' labels on one line, separated by a comma, as in:
You can use a parameter to define a point. If you animate the paramater with a slider, the point will move as the parameter's value varies. For example (click to stop; double-click to play):
Activity: Make a Graphing Calculator document that behaves like what you see below (click to stop; double-click to play). This movie displays the covariation between two variable magnitudes, one of which has a magnitude of a and the other having a magnitude of 0.7a + 1. Be prepared to discuss how dynamic GC graphs like yours could be used to support teaching and learning ideas of covariation, linear function, and proportional reasoning.