1. a. State a viable definition (viz, it works) for the statement: Quantity A changes at a constant rate with respect to Quantity B. What is most subtle about the meaning you gave?
b. Interpret this statement: At x = 3.4 and y = 5.1, a non-linear function k(x,y) has
average rates of change of -2 in the x direction and +3
in the y direction over intervals of length 0.001.
c.
What does the graph of k look like in
the immediate region of the point (3.4, 5.1, k(3.4,5.1))?
2.
 Values
of the function f approximate the amount
of water that has flowed out the mouth of the Amazon (out to sea is positive)
over a particular time span.
Values
of the function f approximate the amount
of water that has flowed out the mouth of the Amazon (out to sea is positive)
over a particular time span.
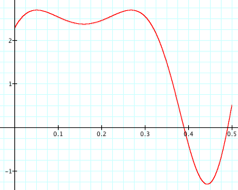
The function r, whose graph is at
the right, gives the average rate of change of f over intervals of length 1 second. The vertical axis
is billions of cubic meters per hour. The horizontal axis is number of days.
a) What
does the point (0.41,-0.81) on this graph of r represent?
b) Interpret
the graph of r. What is it showing?
c) Sketch
a graph of f over the period of time captured
by the graph of r. Use billions
of cubic meters for your vertical axis and numbers of days as your horizontal
axis.
d) Explain
your graph to someone who understands accumulations but is unaware of how you
got this graph.
3. Give
an argument for the claim that any function having a plane as its graph is of
the form f(x,y) = nx + my +
K. Use illustrations as appropriate.
|
4.  Here
are graphs of z = x2y – 4cos(xy)+4 and z = 2, -3 ≤ x, y ≤
3. The coordinate system is oriented with x to the right and z up.
Here
are graphs of z = x2y – 4cos(xy)+4 and z = 2, -3 ≤ x, y ≤
3. The coordinate system is oriented with x to the right and z up.
a)  Sketch the solution set[1]
to the equation x2y –
4cos(xy)+4 = 2.
Sketch the solution set[1]
to the equation x2y –
4cos(xy)+4 = 2.
b)
How, in principle, did you know where to draw your solution
set?